In part 1 I went through the basics, now it’s time to get a bit more exotic. I promised to do some SSD testing, but first I had to check out performance when things are virtualized.
The setup’s pretty much the same as before. I only did the fancy charts for RAID5, but it’s quite similar in other cases, too. So how does SS storage perform under a VM? Pretty well, actually.
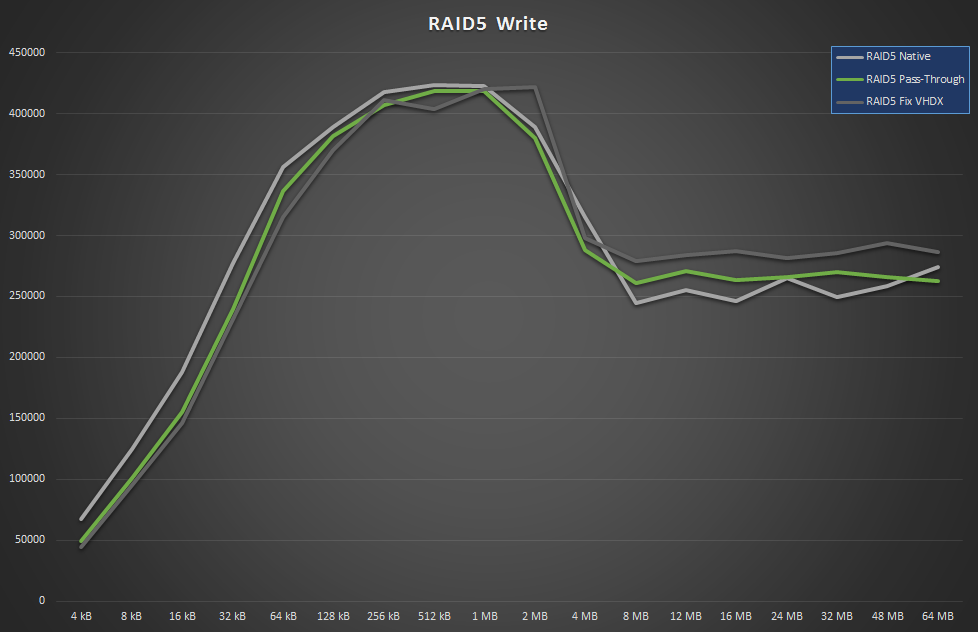
There must be some sort of caching mechanism, because the storage is actually faster in certain cases when virtualized.
This is confirmed by dynamic VHDX performance which I didn’t even add to the charts coz it was totally insane, like out the roof (10GB/s and more). Also, in that case, the guest showed the particular disk to have around 8GB used space (that’s the data length in the ATTO tests), while the VHDX file on the host remained at about 238MB which clearly indicates that the data wasn’t actually written to the physical disk at all – so it’s pointless to add to the diagram.
Clearly, I’d have to do some real-life testing to correctly measure the performance, like moving around ISO files and stuff, but I’ll just believe the Microsoft engineers’ statement that dynamically growing disks are somewhat slower. Anyway, let’s check out read performance, too.
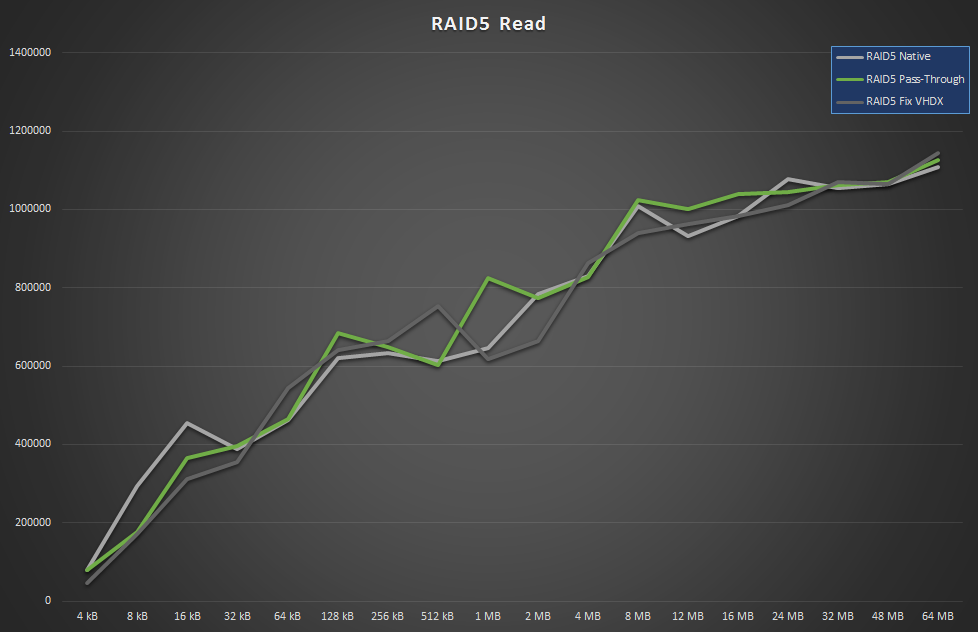
Long story short, Microsoft did a pretty decent job with storage virtualization. If you’re wondering if you should use pass-through or regular VHDX, there’s a detailed post about it: The Time for Hyper-V Pass-Through Disks has Passed.
Update: make sure to check out part 3 for the conclusion!